Hikaru Nakamura's winning streaks
/ 9 minutes / chess statistics games
Chess legend Vladimir Kramnik recently accused Hikaru Nakamura of cheating. He called out one of Hikaru's 46-game winning streaks as supporting evidence, claiming such a streak was highly improbable.
Quoting wikipedia:
In October and November, Nakamura participated in the FIDE Grand Swiss 2023, finishing in second place with 8/11 points (+5-0=6) and thus qualifying for the Candidates Tournament 2024. Vladimir Kramnik made a statement on his Chess.com profile purportedly insinuating that an unnamed high-level player was cheating on November 20. Nakamura believed this post was targeted towards him, and responded with a statement on Twitter reading "Vladimir appears to be referencing my record...is he really accusing me of cheating??? [sic]". Nakamura also expressed disappointment with Ian Nepomniachtchi for reposting Kramnik's claims.
The claim is dubious, at best. But I was curious enough to play with the data myself.
Executive Summary
I started by downloading Hikaru's games from the chess.com API. I wrote code in rust to load these games and re-simulate his chess.com career in order to arrive at probabilities of achieving win streaks. Note that by chess.com career, I mean my analysis is limited to games which happened on chess.com only.
Each game in the series was simulated based on the easily calculated probability of win or loss between two opponents with Elo ratings. I simulated the entire series of 47,407 games one million times. Yes, a million is overkill. But it sounds cool.
My analysis of 47,407 games played by Hikaru on chess.com shows that:
- the probability of hitting at least one 46 game winning streak is 100%, with significant confidence
- the expected number of 46 game winning streaks is 2
- the actual number of 46 game winning streaks in Hikaru's chess.com career is 2
- the amount of BS in this cheating accusation is significantly high
For graphs and some discussion, go straight to Results.
Methodology
Hikaru's ability to win streaks completely depends on the sequence of opponents and his skill difference with each opponent. Skill difference is, rather conveniently, quantified in chess with Elo ratings. Given two Elo ratings, we can determine the probability of one player beating another. Given the historical data, which includes opponents and their Elo ratings, we can re-simulate his career many many times and see how often he wins streaks. This approach is a Monte Carlo method.
If you want to see all the details of my model, browse the code here.
Historical Data
In order to start, I needed Hikaru's history from chess.com, sequenced in order. Order is important because, as a popular chess streamer, Hikaru has frequently played batches of opponents in very specific rating ranges, sometimes significantly lower than his actual rating.
To do this, I used curl to hit the API directly, like this:
# Fetch the list of game archive URLs for the player 'Hikaru' from Chess.com
archive_urls=$(curl -Ls https://api.chess.com/pub/player/Hikaru/games/archives | jq -rc ".archives[]")

# Iterate over each archive URL
for url in $archive_urls; do
    # Fetch the games from each archive and extract the PGN
    curl -Ls "$url" | jq -rc ".games[].pgn"
done >> games.pgn  # Append all PGNs to the 'games.pgn' file
I didn't figure this out on my own. Nope. Just found it on this reddit post.
Assumptions
unwrap() is ok
I'm using rust to code this simulation. We don't need full blown error handling here. This is just a hacky experiment. So, I'm going to use unwrap() wherever I want and be perfectly okay with it. To the coders out there - this isn't how I'd write production code!
Had to say it before my fellow rustaceans jump on me!
Definitions
A streak of 5 wins is also two streaks of 4 wins. So, if you win games 1 2 3 4 5, it also implies you won 1 2 3 4 and 2 3 4 5. For the purpose of this analysis, a streak only refers to the longest streak. Sub-streaks, as I've shown here, are not counted as streaks.
No Elo Updates
The best simulation we could do of Hikaru's chess.com career includes not only using Elo ratings to simulate game outcomes, but then using those simulated outcomes to update his (and his opponent's) ratings.
However, I decided against doing this because I assume (fairly confidently) that many of the pairings in his sequence of games were based on his and his opponent's ratings. Therefore, we simply take the recorded ratings and assume that the game outcomes are based on them.
This means that if we simulate an unlikely loss, we'd expect Hikaru's rating to go down. And therefore, his next opponent might be different. But, since we don't have access to the pairing methodology used in each game, we must assume that the next opponent is the same.
Draw Probability
Given two Elo ratings, we can deterministically find the probability of white or black winning. However, it doesn't tell us anything about draws. In order to simulate draws, we need to use a heuristic assumption. I came up with this:
Where \( K_{\text{max}} \) is the maximum probability of a draw and \( K_{\text{strength}} \) determines how the function scales according to the rating difference.
In my case, I landed on \( K_{\text{max}} = 0.18 \) and \( K_{\text{strength}} = 0.05 \). I admit, I just eyeballed this. I found that about 18% of Hikaru's games were draws. And, I looked at how quickly the probability of a draw goes to zero as the rating difference increases. Feels good enough to me. But, I welcome input on how it can be better.
The resulting rust code looks like:
// estimate probability of draw given two Elo ratings
fn probability_of_draw(white_elo: &Rating, black_elo: &Rating) -> f64 {
    // Constants for draw probability estimation
    let max_draw_probability = 0.18; // Upper limit of draw probability
    let rating_difference_sensitivity = 0.05; // Adjusts sensitivity to rating difference
    let rating_diff = (black_elo.0 as f64 - white_elo.0 as f64).abs();
    max_draw_probability / (1.0 + rating_difference_sensitivity * rating_diff)
}
Adjusted Win Probability
Now that we know the draw probability, we can adjust the win probability. This is done by subtracting 1.0 from the draw probability to arriave at a total (black or white) win probability, and then using the Elo expectation equation to assign that remaining win probability proportionately.
First, find the probability of any player winning:
Next, compute the expectation of winning for each player according to their Elo ratings:
And finally, adjust for the overall win probability, which takes draws into account:
In code, it looks like this:
// estimate probability of white winning, given two Elo ratings
fn probability_of_white_win(white_elo: &Rating, black_elo: &Rating) -> f64 {
    // Expected outcomes for players A and B
    // E_a = 1 / (1 + 10^((b - a) / 400)
    // E_b = 1 - E_a
    1.0 / (1.0 + 10.0f64.powf((black_elo.0 as f64 - white_elo.0 as f64) / 400.0))
}

// estimate probability of black winning given white's probability of winning
fn probability_of_black_win(probability_of_white_win: f64) -> f64 {
    1.0 - probability_of_white_win
}

// given two ratings, compute probabilities of win/loss/draw and return in `ExpectedOutcome`
pub fn calculate_expected_outcome(white_elo: &Rating, black_elo: &Rating) -> ExpectedOutcome {
    // Estimate win probabilities
    let mut p_white = probability_of_white_win(white_elo, black_elo);
    let mut p_black = probability_of_black_win(p_white);

    // Estimate draw probability based on rating difference
    let p_draw = probability_of_draw(white_elo, black_elo);

    // Adjust win probabilities to account for draw probability
    p_white *= 1.0 - p_draw;
    p_black *= 1.0 - p_draw;

    // Sanity check
    assert_approx_eq!((p_white + p_black + p_draw), 1.0);

    ExpectedOutcome {
        // Estimate win probabilities
        white: p_white,
        black: p_black,
        draw: p_draw,
    }
}
Game Simulation
We simulate a game by using the two players' Elo ratings to compute teh win probability of each player and the draw probability, which always sums to 1.0. Then we simply use a random number to choose a simulated outcome. Here's the rust code:
// simulates a single game
fn simulate_game(white_elo: &Rating, black_elo: &Rating) -> Outcome {
    // Get expected outcomes
    let e = calculate_expected_outcome(white_elo, black_elo);

    // Roll the dice
    let mut rng = rand::thread_rng();
    let random_value = rng.gen::<f64>();

    // Determine and return outcome
    if random_value <= e.white {
        Outcome::WhiteWin
    } else if random_value <= (e.white + e.black) {
        Outcome::BlackWin
    } else {
        Outcome::Draw
    }
}
Now to simulate the entire series of Hikaru's games, we just apply this function to the historical games to come up with a new set of outcomes.
Like this:
// simulate a series of games and return a new simulated `Vec<Game>` series
pub fn simulate_games(actual: &[Game]) -> Vec<Game> {
    actual
        .iter()
        .map(|g| Game {
            white: g.white.to_owned(),
            black: g.black.to_owned(),
            outcome: simulate_game(&g.white.rating, &g.black.rating),
        })
        .collect()
}
Once we have all the (one million!) simulated chess.com careers, we build histograms of achieved streaks for each and then merge them into a single histogram for the entire simulation. Here it is all together:
let iterations = 1_000_000;
let histograms: Vec<HashMap<usize, usize>> = (0..iterations)
    .into_par_iter()
    .map(|_| {
        let simulated_games = simulate_games(&games);
        generate_win_streak_histogram("Hikaru", &simulated_games)
    })
    .collect();

// Reduce the histograms into a single histogram
let merged_histogram = histograms
    .into_iter()
    .reduce(|mut acc, h| {
        for (k, v) in h {
            *acc.entry(k).or_insert(0) += v;
        }
        acc
    })
    .unwrap();
Note the use of rayon with into_par_iter(). This is a really nice bit of code which makes it trivially easy to use all my cores.
You can find all of my code here.
Results
I simulated the entire 47,407 game sequence one million times. This section details my findings.
Actual Winning Streaks
Before getting into the model's results, I think it's interesting to look at what we found in Hikaru's data.
My code reports a good number of long winning streaks in Hikaru's chess.com career. Here are his 40-game and longer streaks, along with the number of times he achieved each:
Streak Length:  40, Count: 4
Streak Length:  41, Count: 2
Streak Length:  42, Count: 4
Streak Length:  43, Count: 1
Streak Length:  44, Count: 1
Streak Length:  45, Count: 2
Streak Length:  46, Count: 2  <= OMG DID HE CHEAT WTF 🤡
Streak Length:  47, Count: 6
Streak Length:  48, Count: 1
Streak Length:  50, Count: 1
Streak Length:  51, Count: 2
Streak Length:  52, Count: 1
Streak Length:  54, Count: 3
Streak Length:  55, Count: 2
Streak Length:  56, Count: 2
Streak Length:  57, Count: 1
Streak Length:  58, Count: 1
Streak Length:  59, Count: 2
Streak Length:  61, Count: 2
Streak Length:  62, Count: 1
Streak Length:  69, Count: 1
Streak Length:  72, Count: 1
Streak Length:  77, Count: 1
Streak Length:  78, Count: 1
Streak Length:  82, Count: 1
Streak Length:  85, Count: 1
Streak Length: 100, Count: 1
Streak Length: 117, Count: 1
Yes, you're seeing that right. There are 85, 100, and even 117 winning streaks. You see, these streamers will sometimes play a lower-rated player many times consecutively. If they prevail some pre-chosen number of times (say, 100), then they will colloquially say that they "adopted" that player. It's fun. And this is why it's important to look at the entire, exact sequence of opponents Hikaru played.
Probability of Win Streaks
Based on my analysis, the following chart shows the probability of getting at least one winning streak. For example, if you look at 46 on the x-axis, you'll see its probability is 100% on the y-axis.
As another example, you can see that the probability of hitting at least one 80-game winning streak is just a bit below 30%.
We can even see about a 5% change Hikaru would've hit a 140 game streak. So, if there were 20 parallel Hikaru's playing exactly the same games, maybe one of them would have pulled this off.
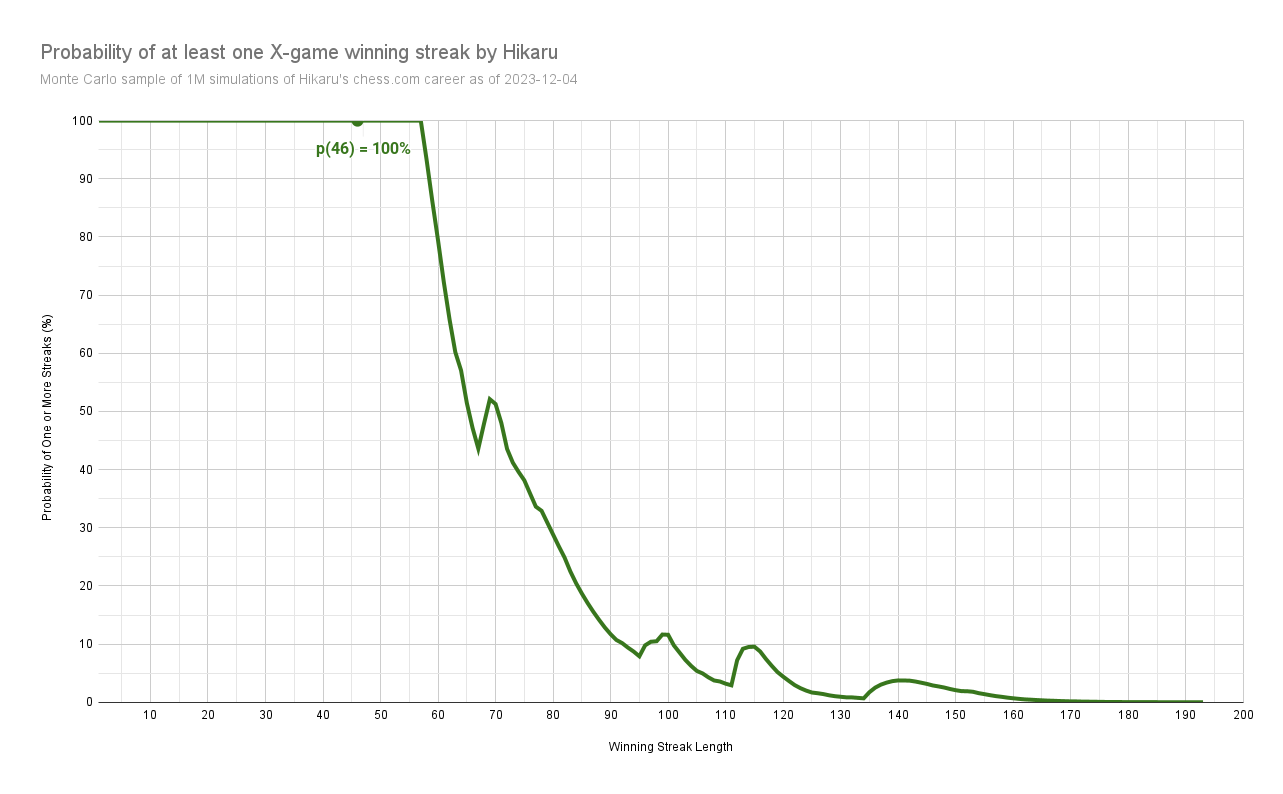
Oh, but what about those weird bumps at the 70, 100, 115, and even 140 streaks? Again, remember that this is based entirely on the sequence of opponents Hikaru played. If at some point in his nearly 50k games he played someone rated significantly lower than him for 70, 100, 115, or 140 times consecutively, then that increases the probability of winning that streak.
And when we look at the data, Hikaru does in fact have streaks at 69, 72, 77, 78, 82, 85, 100, and 117.
Herein lies the plainly obvious reasoning that Kramnik seems to be missing.
Expected Number of Win Streaks
Probability is one thing. In this case, it removes all doubt about the possibility of achieving something like a 46-game winning streak.
But what's more interesting when we look at whether someone cheated is how close to the expectations they performed. The chart below plots both the expected number of each winning streak and actual number of winning streaks recorded in Hikaru's career.
The red line is the number of streaks predicted by my modeling. The blue line is the number of streaks Hikaru scored.
For example, we can see that we expect Hikaru to get about 35 streaks of 20 wins. Just look across the x-axis to 20, and go up to find that the red line crosses about about 35. But note that the blue line shows Hikaru only actually got about 28 of those 20 game streaks.
If we look at the 46 streak data point, we see an expectation of 2. And we also see an actual of 2. Hmmmmm....
One note on this chart: the y-axis is logarithmic. This makes it so that we can show a much larger range of data. It might seem a little weird to some, but it's pretty normal.
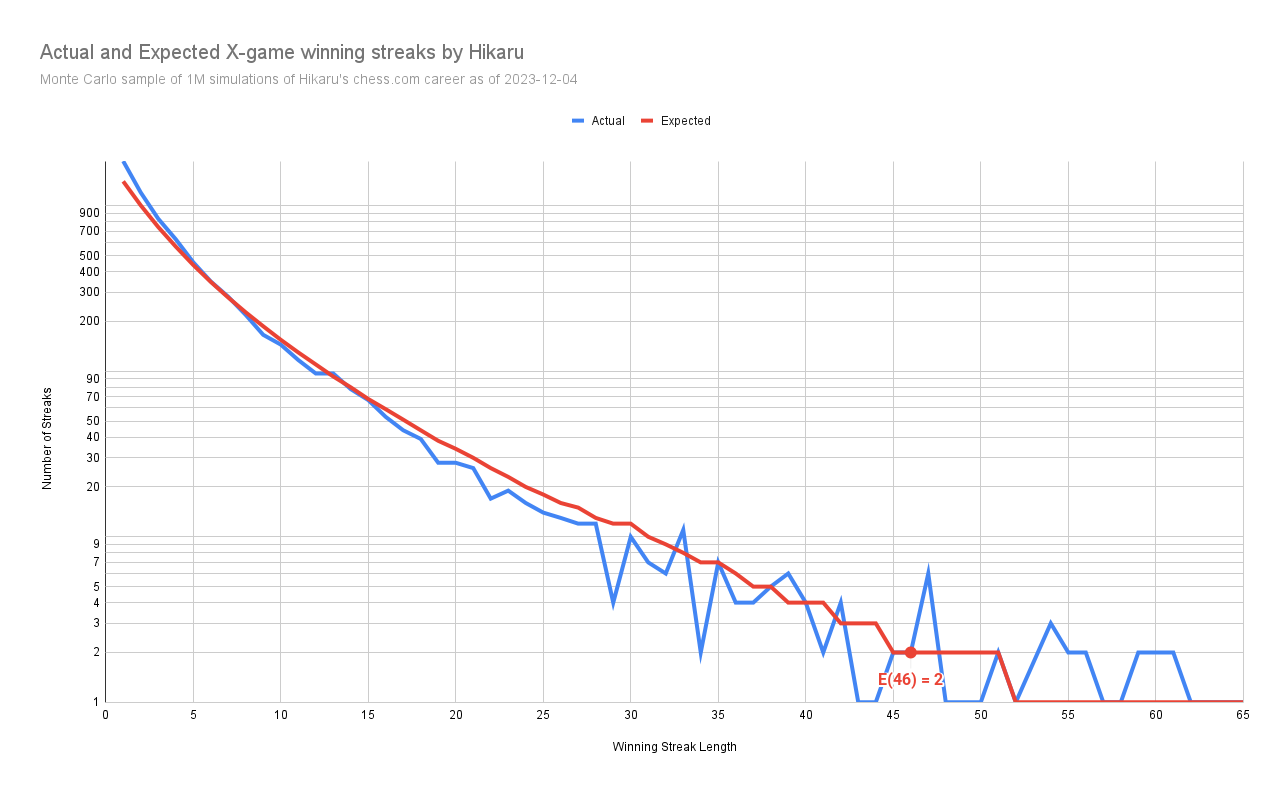
The data gets a bit noisy to the right of the 25 streak line. This is because such streaks occur less frequently, and thus our sample size gets quite a bit smaller.
How is Hikaru Performing?
Now, let's plot the difference between what Hikaru did and what my simulation expects at each of the streaks of 20 and higher.
To use this chart, look for a winning streak on the x-axis, like 55. We see that the (actual - expected) is 1. This means that Hikaru recorded 1 more 55-game winning streak than expected.
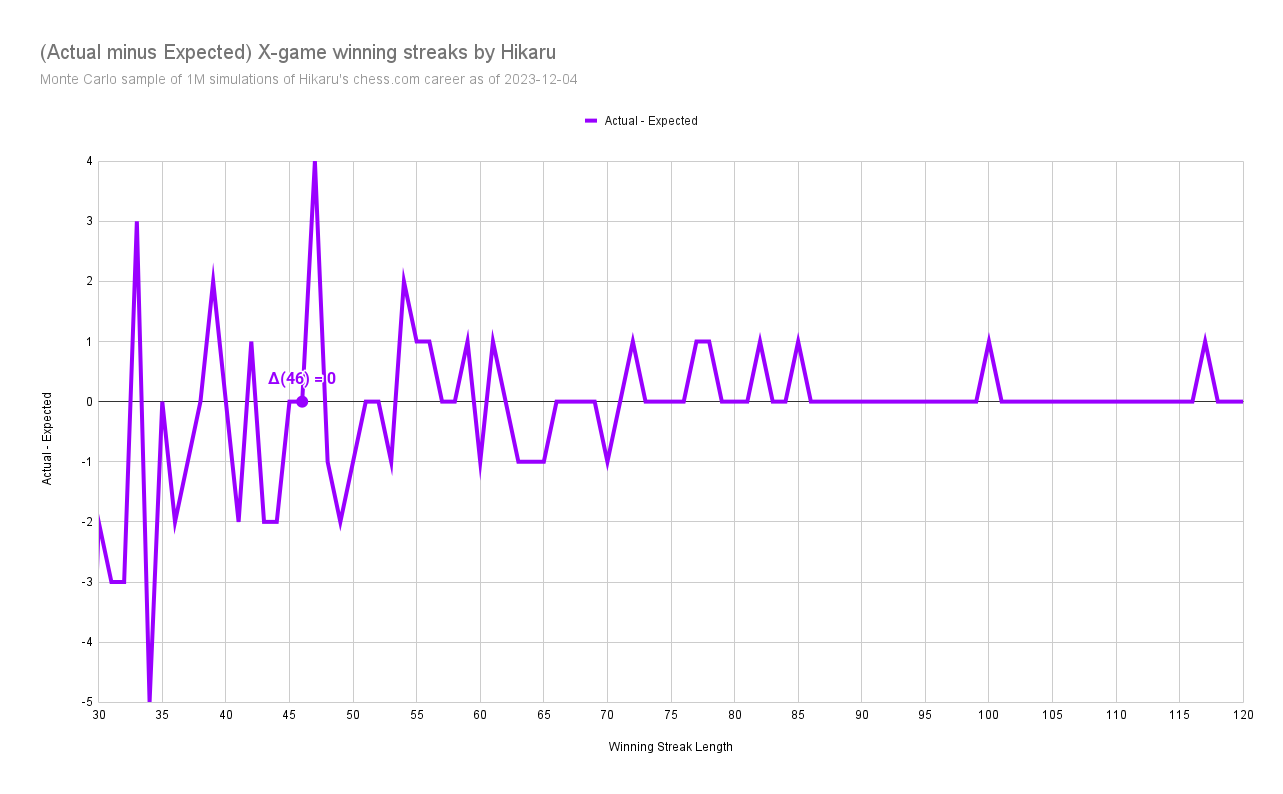
Generally, we can see that for streaks 20 and above, Hikaru is performing just about as expected. If we smoothed this line to account for the noisiness at this end of the data, we'd find that he's well within the margin of expectations.
Closing
Hikaru's win streaks on chess.com are normal. As I said in the beginning, my analysis of 47,407 games played by Hikaru on chess.com shows that:
- the probability of hitting at least one 46 game winning streak is 100%, with significant confidence
- the expected number of 46 game winning streaks is 2
- the actual number of 46 game winning streaks in Hikaru's chess.com career is 2
- the amount of bullshit in this cheating accusation is significantly high
Being great at one thing, chess in this case, doesn't mean you're great at everything. Even being literally one of the best chess players in the world is not a reason to think someone is smart. But, our society tells people who achieve greatness in chess that they're smart. And apparently for some folks, especially in this case, that's gone to their head. Now, perhaps Kramnik has some other evidence to Hikaru's cheating. But, what we've seen thus far - the 46 game winning streaks - is not enough. It's not enough for even the most basic of high-school level math and statistics. And so, being chess world champion does not mean you're smart.
That said, many chess players are actually damn smart. It tends to attract the bookish type who are into educating themselves. And, nothing but respect from me for people who can play chess. I am not one of those people.
If you find a mistake in my work that shows I'm wrong, please let me know!
And finally, I'll leave you with this, courtesy of ChatGPT and DALL-E:
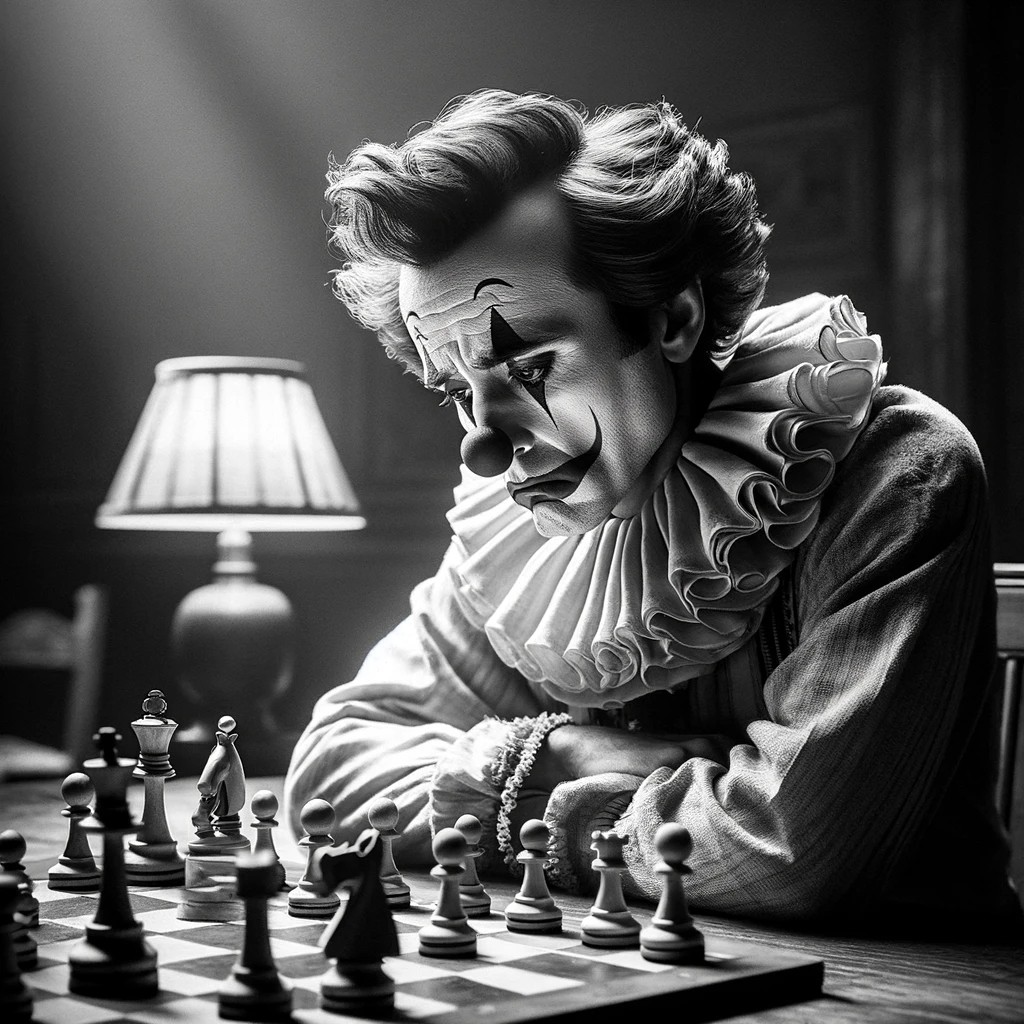
A portrait of a sad clown sitting at a chess table, deeply engrossed in a game of chess. The clown has a striking resemblance to a tall, slender man with sharp facial features, reminiscent of a famous chess grandmaster. He wears a traditional clown outfit with a ruffled collar and a small hat, and his face is painted with exaggerated sad expressions. The setting is a dimly lit room, with a focus on the chessboard and the contemplative pose of the clown.